Objective: Learn the basic commands to create and edit tables.
Basic tables can be created with a combination of the commands below and the use package: tabularx
| Basic Commands | Description |
|---|---|
l, r, c | column alignment |
& | ampersand separates columns |
\\ | double backslash begins new row |
\hline | horizontal line |
| | | vertical line |
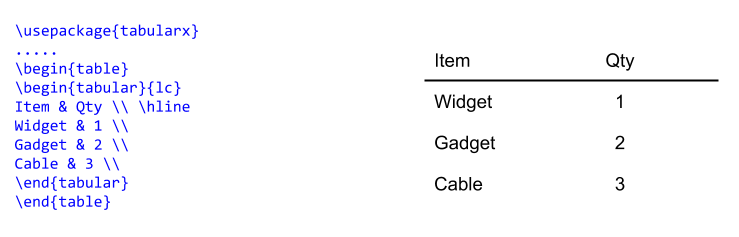
Example: Creating a basic two column table
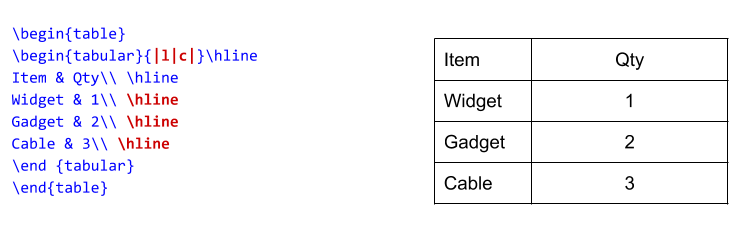
Example: Adding vertical and horizontal lines
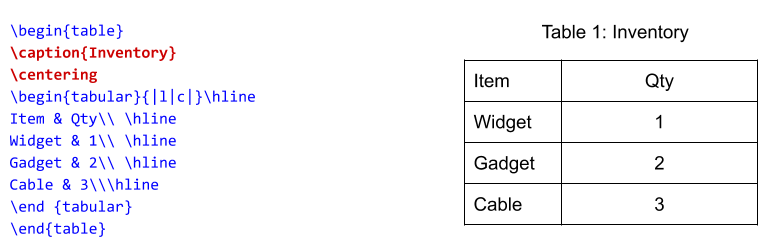
Example: Centering and adding a caption
Note the addition the \caption and \centering commands.
Exercise 1: Basic Table
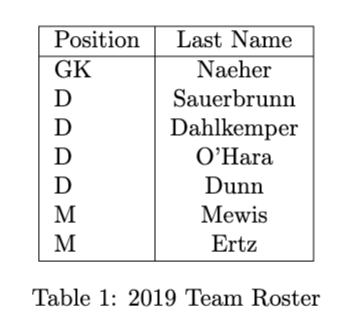
Use the tabularx package to create a simple table of the US Women’s Soccer Team’s 2019 World Cup Starting Roster.
Begin with a header row and two columns.
Your two column headers will be: Position and Last Name – Left align the text of the left column
Center the text of the right column
Add vertical and horizontal lines
Add a caption “2019 Team Roster” and center the table.
Note: Using the \caption{} command will add the phrase “Table 1” in front of caption.
Use package needed: tabularx
Commands needed:& = column separator\\ = begin new rowl, r, c = column alignment
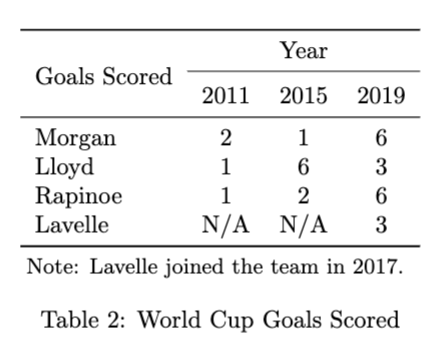
Exercise 2: Multirow, Multicolumn Tables
Create a table like the one below with columns spanning multiple rows or rows spanning multiple columns.
Packages needed:
\usepackage{booktabs}\usepackage{multirow}\usepackage{tablenotes}
This is the style that many journals require. It will give you the basic stepping stones to create charts like:
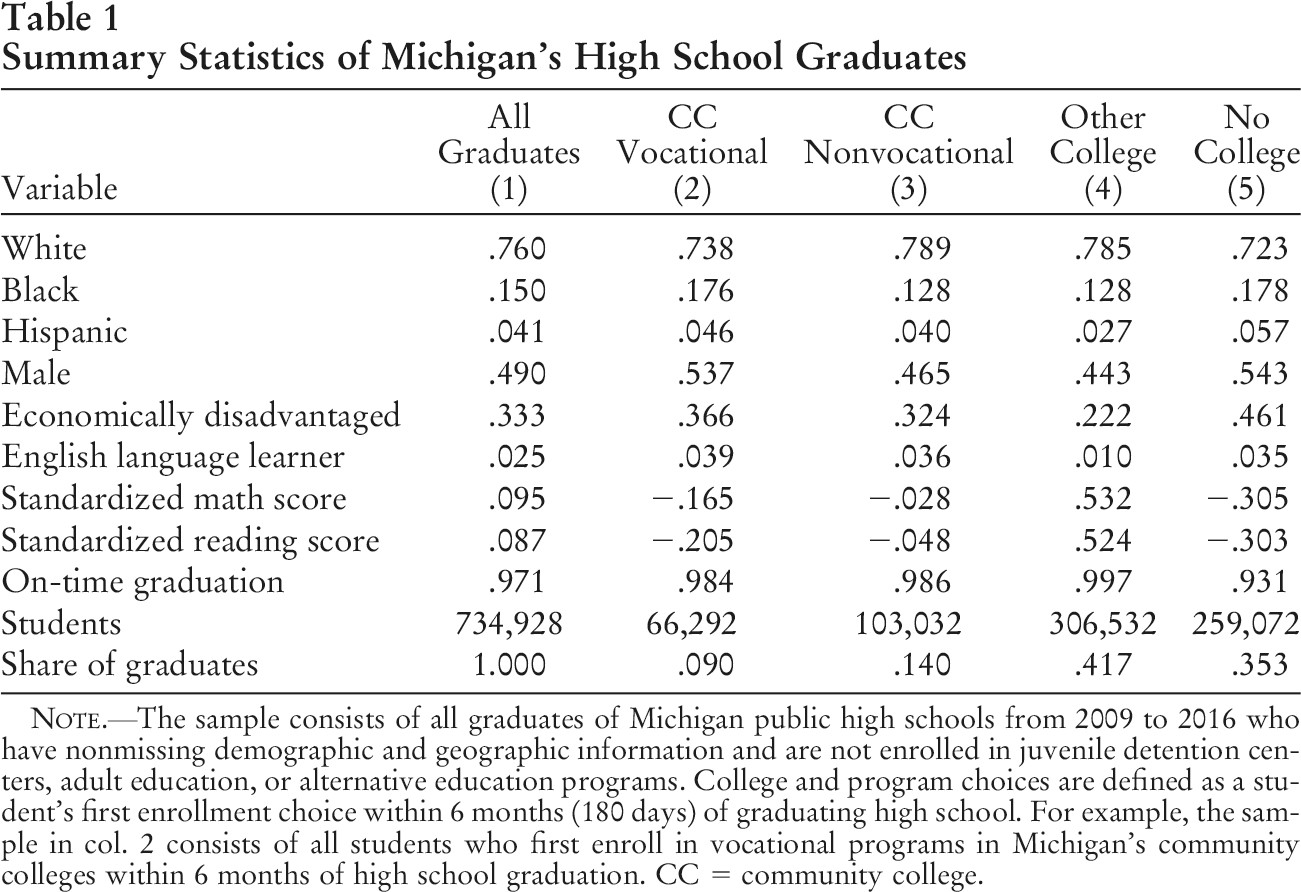
from: Acton, Riley K. “Community college program choices in the wake of local job losses.” Journal of Labor Economics 39.4 (2021): 1129-1154. Acton (2021)
Questions?
Consult the answer key in the Overleaf Project to troubleshoot: https://
More information sources:
Roster: https://
www .ussoccer .com /players Tables info: https://
en .wikibooks .org /wiki /LaTeX /Tables Multicolumn/Multirow: https://
en .wikibooks .org /wiki /LaTeX /Tables
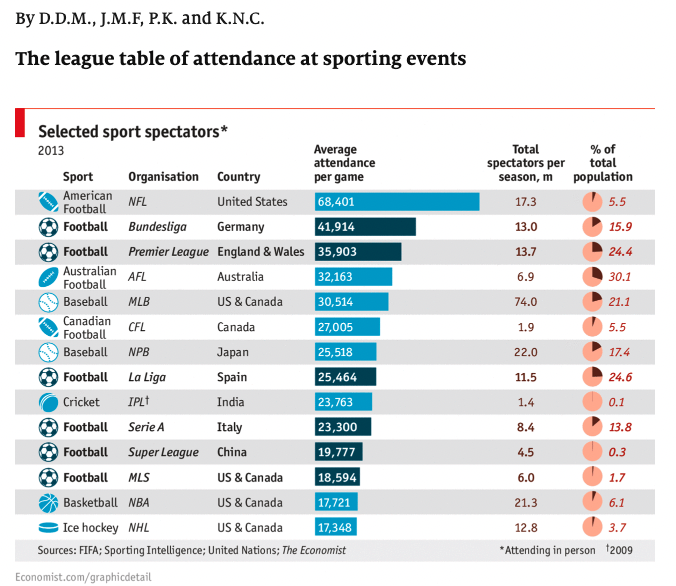
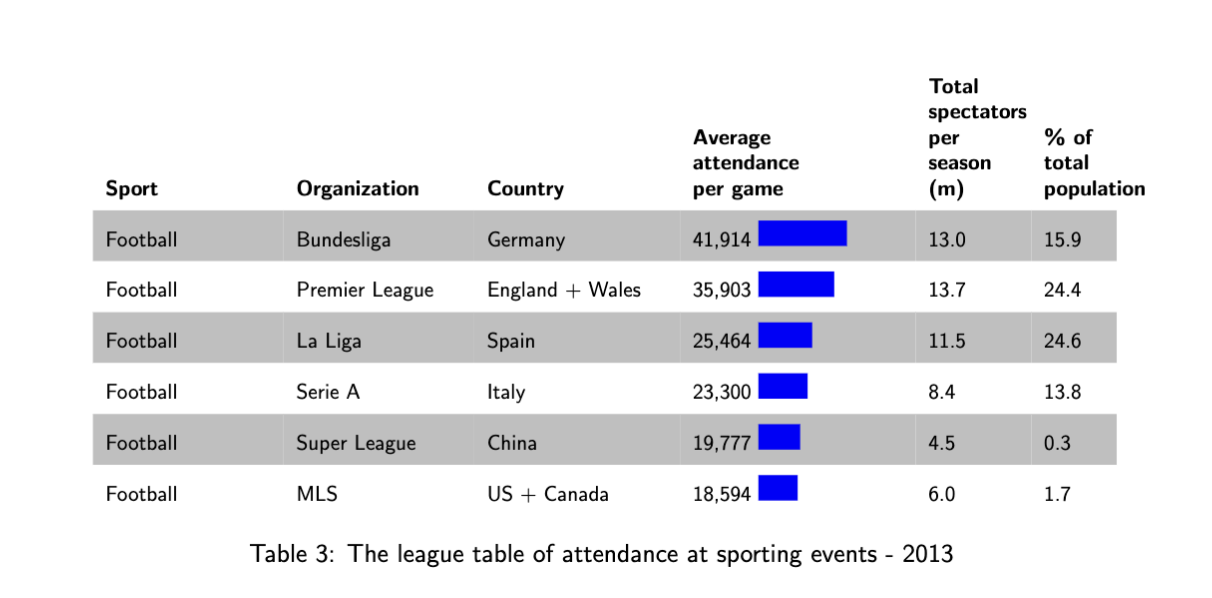
Exercise 3: Challenge - Incorporating Bar Charts
Let’s try to recreate this figure showing attendance at football events in 2013 from the Economist.
There are a number of ways to get started, but these are some of the steps you will need to take:
Make a table: Create a tabular enviroment
Columns: Add the appropriate number of columns
Data: Start adding data to your rows
Fonts: Can you change the default font to sanserif, can you make the header row bold?
Color: Can you introduce alternating row colors?
Spacing: Can you adjust column width and row height?
Extra: How can you include a bar for scale next to a numeric value?
Remember there are many ways to accomplish the same thing in LaTeX. Getting the results you want may take some trial and error.
Exercise 4: Converting a pandas table into LaTeX
There are many ways to convert a table into LaTeX. One common scenario involves converting and exporting a Pandas Dataframe into a LaTeX formatted table.
This can be accomplished using the command:
print(df.to_latex())
First create your dataframe, then print using the above command. See below:
import pandas as pd

df = pd.DataFrame(dict(state=['California', 'Colorado'],
                  mountain=['Whitney', 'Elbert'],
                  flower=['poppy', 'columbine']))
print(df)
UsageError: Line magic function `%Create` not found.
import pandas as pd

df = pd.DataFrame(dict(state=['California', 'Colorado'],
                  mountain=['Whitney', 'Elbert'],
                  flower=['poppy', 'columbine']))
print(df.to_latex())
\begin{tabular}{llll}
\toprule
{} & state & mountain & flower \\
\midrule
0 & California & Whitney & poppy \\
1 & Colorado & Elbert & columbine \\
\bottomrule
\end{tabular}
Information sources
Soccer Roster: https://
www .ussoccer .com /players General Table Information: https://
en .wikibooks .org /wiki /LaTeX /Tables Multicolumn/Multirow: https://
en .wikibooks .org /wiki /LaTeX /Tables #Defining _multiple _columns Bar charts within tables: https://
tex .stackexchange .com /questions /173042 /is -it -possible -to -create -a -barchart -in -a -table Pandas Conversion: https://
pandas .pydata .org /docs /reference /api /pandas .DataFrame .to _latex .html
- Acton, R. K. (2021). Community College Program Choices in the Wake of Local Job Losses. Journal of Labor Economics, 39(4), 1129–1154. 10.1086/712555